Market Update from Power Lyons Real Estate Solutions – July 20th, 2015
Please click on image below to view a high quality PDF of the monthly newsletter. Thanks and please don’t hesitate to contact me should you have any questions.


Please click on image below to view a high quality PDF of the monthly newsletter. Thanks and please don’t hesitate to contact me should you have any questions.
Also, Please note that not all areas of Ottawa are the same. Some pockets are more active than others. If you would like more details from your area, right down to your street, please don’t hesitate to call. 613-492-MOVE (6683)

Power Lyons Real Estate Solutions has an even better year in 2014! Congratulation on winning the TRIPLE GOLD AWARD. This is awarded to agents with over 60 units sold! This makes us top 1% in the nation 2 years running! Many many thanks to all of our cherished clients who have helped us to make this happen. Also a special thanks to our support staff at Keller Williams Solid Rock and on the Power Lyons Real Estate Solutions Team. Could not have done it without you !
!
Jeff Lyons, Team Lead for Power Lyons Property Marketing, was doing some homework for a buyer client and thought to publish this information in his blog. Jeff gathered data for average list price to sale price ratios for homes that have sold in the last 5 months, as well as the average days on market for these homes. The criteria were geographical location below, for homes listed in the $680k-$980k price range. Below is a summary of the data from November 1st to March 28th, 2014. If you would like details, please don’t hesitate to contact Jeff Lyons at 613-897-5593.
Below is the area searched (The red tags are November’s data)
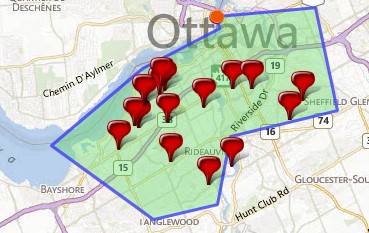
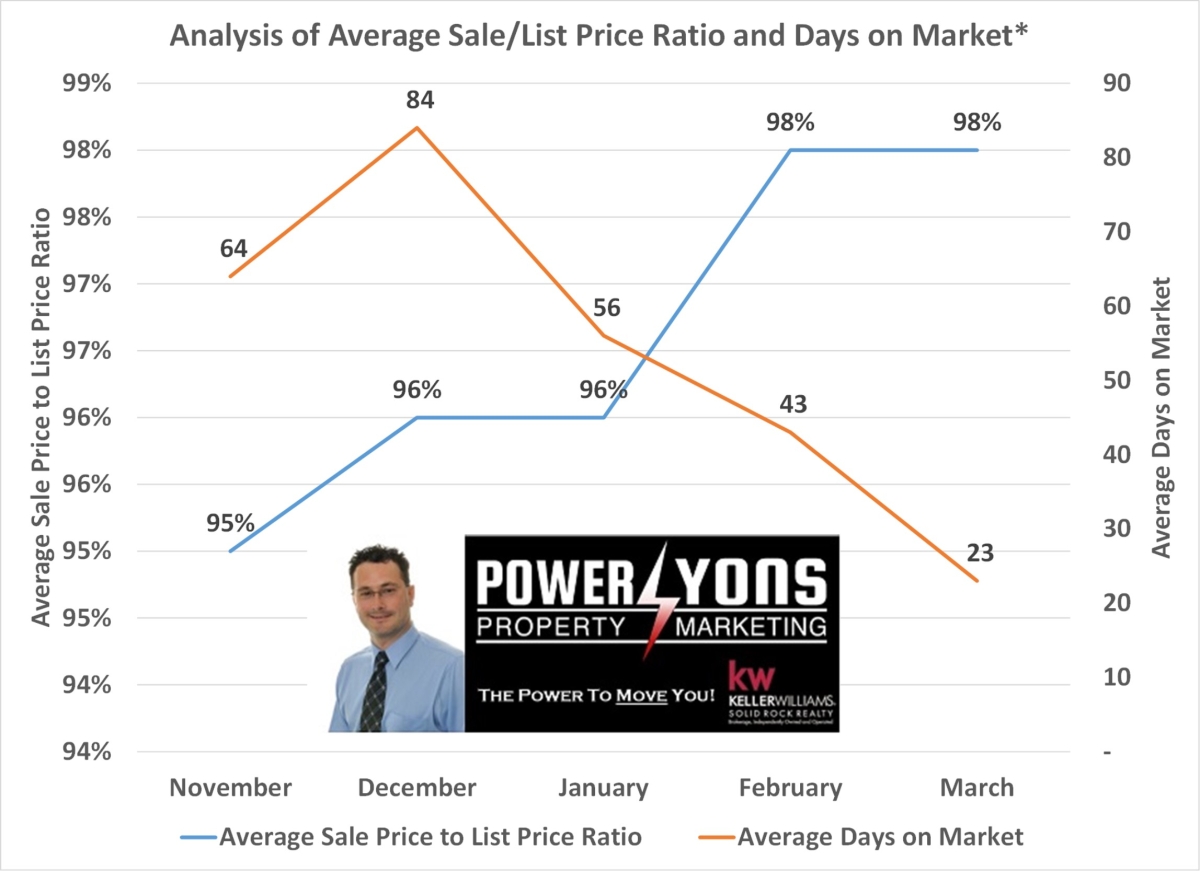
*For homes in the above geographic region listed between $680,000 and $980,000
(click on above graph for it to come up larger and more defined)
As expected prices are firming up and average days on market are dropping as we go into spring. This is average data, and the negotiation potential of each home is different depending on days on market and local comparables.
If you are a buyer, and are looking to work with someone who understands the market, don’t hesitate to call Jeff Lyons at 613-897-5593.
Also the above analysis is a wonderful tool I use to help get top dollar when negotiating for Seller clients.
I know that property taxes are a source of frustration for many of us, including me. I happened upon this article and thought to share it with you all, as I found it very informative.
By Mike Aubry,Ottawa Sun – First posted: | Updated:
To get to the root of the matter, we talk to veteran tax expert John Clark, vice-president of valuation and consulting at the Regional Group of Companies.
Q: How is a home’s value assessed?
A: MPAC does that through a statistical modeling process that is based on market value. MPAC doesn’t visit each home individually, but instead uses a computer formula that looks at a wide range of factors to judge a home’s value. It takes into account the location, lot size, building size and building condition.
Q: Why do assessments happen every four years?
A: The provincial government sets the rules and in different places in Canada it’s done differently. Ontario is every four years, Quebec is three years and some places are every year. But the more frequently you do it, the annual changes become smaller and if you did it every 10 years, the changes would be much more dramatic and more politically damaging.
Q: Why would my assessment go up or down?
A: It’s all a function of how the market is behaving. In Ottawa, some neighbourhoods are becoming increasingly popular, while others haven’t fared so well. It depends on what people are paying for properties.
Q: Which Ottawa neighbourhoods will see increases and which will go down?
A: They’re all going to go up, but some will go up faster than others. Hintonburg, Westboro, the Glebe, Sandy Hill and Centretown are set for a large increase. But some of the rural areas like Osgoode may not go up so fast, and the suburban areas like Orléans, Kanata and Barrhaven will be going up probably about the average. They’re attractive, but they’re not “hot” neighbourhoods in demand.
Q: Does an increase in value automatically mean I’ll pay more taxes?
A: No, an increase in a property’s assessed value only translates into a tax increase if the increase in value is higher than average in Ottawa since 2008. The average increase this year is 25%, or 6% per year.
Q: Can I ask for a re-assessment if I think the numbers are off?
A: Yes. Homeowners should look at other similar properties in their neighbourhoods on the MPAC website. If they feel the assessment is off, they can appeal to MPAC and have the home re-assessed. (In 2009, 4.24% of homeowners asked for a re-assessment for a total reduction of $6.96 billion.)

